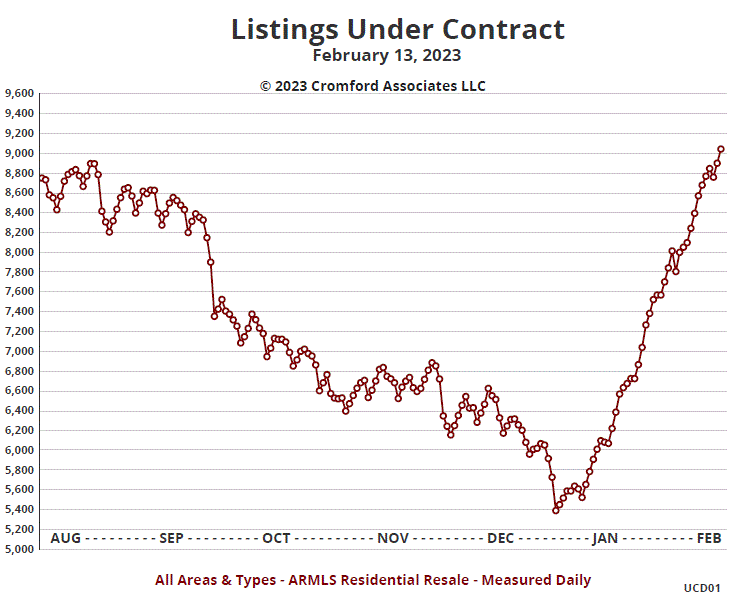
The recovery in listings under contract since the start of January has been spectacular, as can be seen from the first chart above.
Of course, this was from a very low start below 5,400 but cracking the 9,000 by mid February is impressive. We remain 27% below the count on February 13, 2022, so we are really back to normal rather than the wild and crazy market we had 12 months ago.
If we can stay over 9,000 for several months, we will have established "relief" as the next stage of the market cycle, and optimism will be appropriate for the second half of the year. That is an uncertain if, but not an unlikely one.
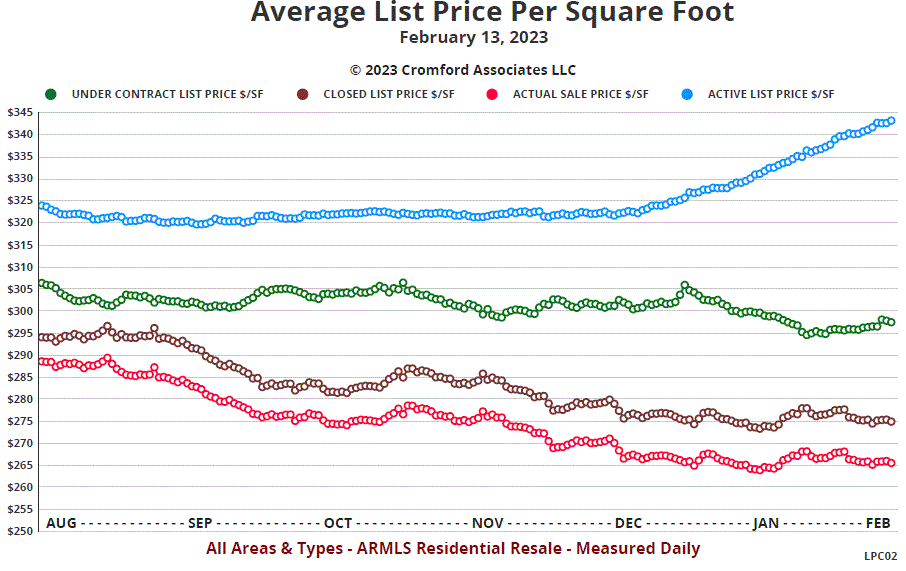
The six-month list price per square foot chart supports the theory that the market is improving for sellers.
We can immediately see that sellers have become much more optimistic on pricing since mid-December, with the average $/SF for active listings up from $322 to $343, a rise of 6.5% in just 2 months.
The average $/SF for listings under contract had been on a slow downward trend, but hit bottom on Jan 26 and has been on a very mild and somewhat unconvincing upward trend since then.
The average $/SF sales price for closed listings has been trundling along around $265 since mid December and is showing little intention of dropping further at this point. In the current environment we would be surprised to see it hit new lows but things could change if demand were hit by another significant rise in mortgage rates.
Supply remains weak by long term standards.
Please let me know if you would like to take a deeper dive into the Stats of the Market. I am happy to oblige.
My best,
Deanna
.png "Image")